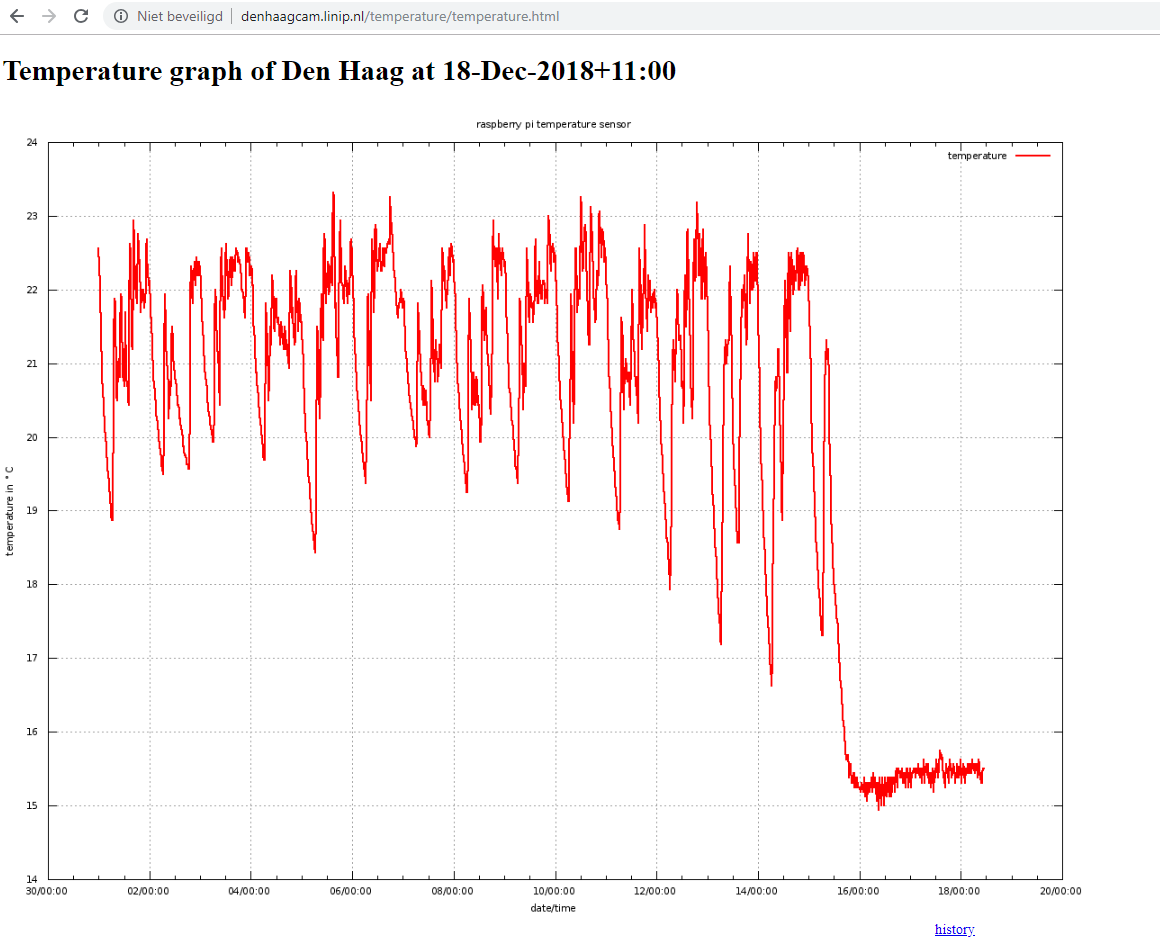
The DS18B20 is a cheap and accurate temperature sensor. The following commands and scripts wil create a temperature graph on a local website.
Connect sensor to raspberry pi
source: link
You will also need a 4.7 kΩ resistor.
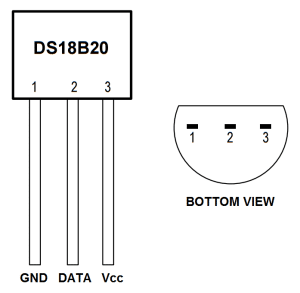
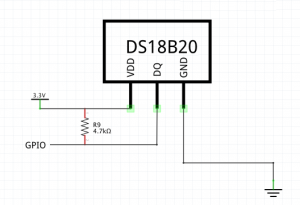
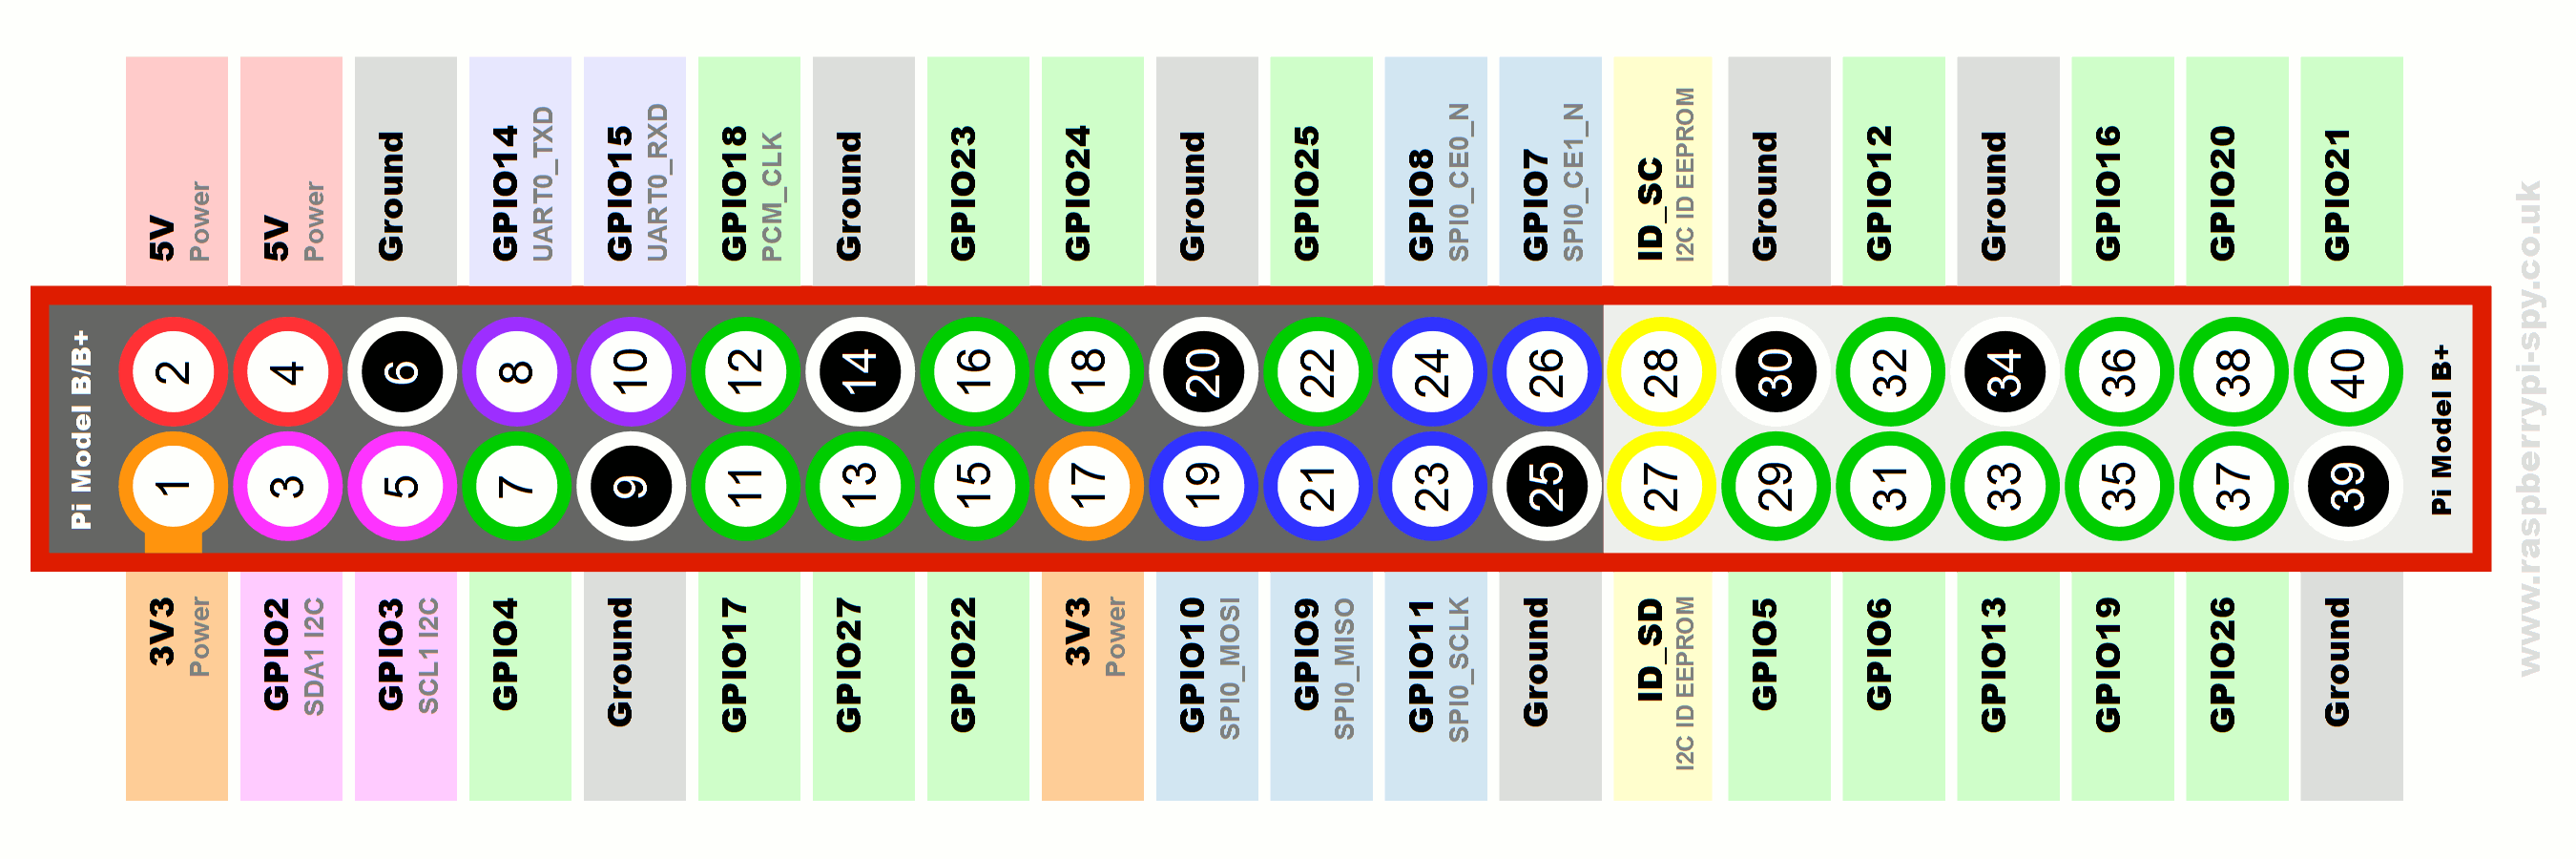
Data to PIN 7 (GPIO4)
Ground to PIN 6
Vcc to PIN 1 (3.3 Volt)
enable the One-Wire interface:
At the command prompt, enter:
sudo nano /boot/config.txt |
then add this to the bottom of the file:
dtoverlay=w1–gpio |
Exit Nano, and reboot the Pi:
sudo reboot |
Log in to the Pi again, and at the command prompt enter:
sudo modprobe w1–gpio sudo modprobe w1-therm |
Write temperature value to csv files:
To find the address of your sensor do:
ls /sys/bus/w1/devices/ |
For calculating with float values you will need the bc package:
sudo apt-get install bc |
The following bash-script reads the value from the temperature sensors and outputs the value to a file.
Filename: write_temp_data.bash
Description: read sensor, and write value with datetime-stamp to file
#!/bin/bash TT="$(echo "scale=3; `cat /sys/bus/w1/devices/28-0000075e7fa2/w1_slave | tail -n 1 | cut -d " " -f10 | tr -cd '[[:digit:]]' `/1000" | bc -l )" DATE=$(date +%Y-%m-%d" "%H:%M) echo $DATE $TT DY=$(date +%Y) DM=$(date +%m) FILE="DS_DATA_"$DY"_"$DM".csv" echo $DATE" "$TT >> $FILE |
Create png and copy to website
You will need the gnuplot package:
sudo apt-get install gnuplot |
Filename: create_temp_page.bash
Description: generate png from csv file with gnuplot, update the html file with the new image and date
#!/bin/bash # run as root cd /home/pi/temperature DY=$(date +%Y) DM=$(date +%m) DATE=$(date +%d-%b-%Y+%H:%M) csvfile="DS_DATA_"$DY"_"$DM".csv" cp temperature.gnuplot.bkp temperature.gnuplot sed -i "s/REPLACE/$csvfile/g" temperature.gnuplot gnuplot < temperature.gnuplot cp temperature.png /var/www/html/temperature cp /var/www/html/temperature/temperature.html.backup /var/www/html/temperature/temperature.html sed -i "s/DATE/$DATE/g" /var/www/html/temperature/temperature.html |
Filename: temperature.gnuplot.bkp
Description: gnuplot template script file
reset set terminal png size 1200,900 enhanced font "/usr/share/fonts/liberation/LiberationSans-Regular.ttf,8" set title "raspberry pi temperature sensor" set xlabel "date/time" set ylabel "temperature in {\260}C" set grid set output "temperature.png" set xdata time set timefmt "%Y-%m-%d %H:%M" set format x "%d/%H:%M" plot "REPLACE" u 1:3 with lines lc rgbcolor "red" lw 2 title "temperature" |
Filename: create_year_graph.bash
Description: At the last day of the month generate a png with all data starting at the beginning of the year
#!/bin/bash YEAR=`date +%Y` cd /home/pi/temperature/ if [ "$(date --date=tomorrow +\%d)" == "01" ]; then rm DS_DATA_$YEAR"_all".csv for f in DS_DATA_$YEAR* do echo $f cat $f >> DS_DATA_$YEAR"_all".csv done csvfile=DS_DATA_$YEAR"_all".csv cp temperature.gnuplot.year.bkp temperature.gnuplot.year sed -i "s/REPLACE/$csvfile/g" temperature.gnuplot.year gnuplot < temperature.gnuplot.year mv temperature.png temperature_$YEAR"_all".png cp temperature_$YEAR"_all".png /var/www/html/temperature/ fi |
Filename: temperature.gnuplot.year.bkp
Description: gnuplot template script file for year graph
reset set terminal png size 1200,900 enhanced font "/usr/share/fonts/liberation/LiberationSans-Regular.ttf,8" set title "raspberry pi temperature sensor" set xlabel "date/time" set ylabel "temperature in {\260}C" set grid set output "temperature.png" set xdata time set timefmt "%Y-%m-%d" set format x "%Y-%m" plot "REPLACE" u 1:3 with lines lc rgbcolor "red" lw 2 title "temperature" |
Website
For the website you will need a webserver with php support.
In short it comes down installing with apt-get:
sudo apt-get install apache2 -y sudo apt-get install php libapache2-mod-php -y |
Then create a temperature folder in your web folder:
cd /var/www/html sudo mkdir temperature |
Filename: temperature.html.backup
Description: html template file
<!DOCTYPE html> <HTML> <TITLE></TITLE> <BODY> <H1> Temperature graph of Den Haag at DATE</H1> <img src="temperature.png"> <br> <center><a href="history.php"> history </a></center> </BODY> </HTML> |
Filename: history.php
Description: php file for viewing previous months/years graphs
<?php echo "<!doctype html>"; echo "<html lang=\"en\">"; echo "<head>"; echo "<title>history</title>"; echo "</head>"; echo "<body>"; echo "<h1>History temperature graph Den Haag</h1>"; $arr = array("."); $format = ".png"; for($x=0;$x<count($arr);$x++){ $mm = $arr[$x]; foreach (glob("$mm/*$format") as $filename) { if ( strlen($filename) == 24 ){ $monthNum = substr($filename,14,2); $monthName = date('F', mktime(0, 0, 0, $monthNum, 10)); $year=substr($filename,16,4); $order[$filename] = $year . $monthNum; } if ( strlen($filename) == 26 ){ $year=substr($filename,14,4); echo "Jaaroverzicht: <a href=\" ". $filename ."\">" . $year . "</a><br>"; } } } asort($order); echo "<BR>"; foreach ($order as $key => $val) { $year= substr($val,0,4); $monthNum = substr($val,4,2); $monthName = date('F', mktime(0, 0, 0, $monthNum, 10)); echo "<a href=\" ". $key ."\">". $monthName . " " . $year . "</a><br>"; } echo "<br>"; echo "<a href=\"temperature.html\"> current month </a>"; echo "</body>"; echo "</html>"; ?> |
Filename: backup_temperature_pic.bash
Description: At the last day of the month: backup the month graph
#!/bin/bash if [ "$(date --date=tomorrow +\%d)" == "01" ]; then month=$(date +%m) year=$(date +%Y) cp /var/www/html/temperature/temperature.png /var/www/html/temperature/temperature_$month$year.png fi |
Crontab
read/write sensor value every 15 minutes
*/15 * * * * /home/pi/temperature/./write_temp_data.bash |
Update temperature webpage every hour
*/60 * * * * /home/pi/luxsensor/./create_temp_page.bash |
Update year graph last day of the month
40 21 28-31 * * /home/pi/temperature/./create_year_graph.bash 55 23 28-31 * * /home/pi/temperature/./backup_temperature_pic.bash |