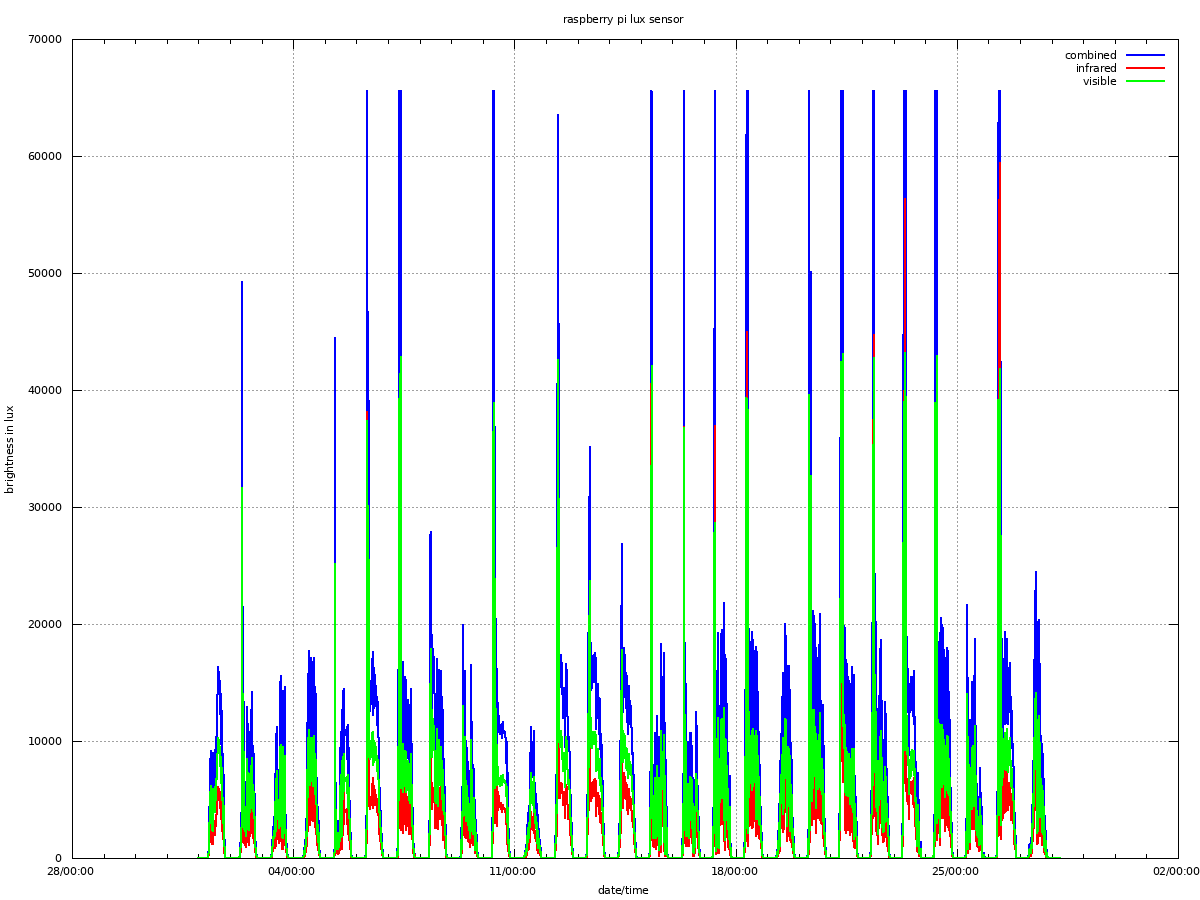
For measuring light intensity I used the TSL2561 luxsensor.
I created some scripts that makes automatically a graph website of your lux values.
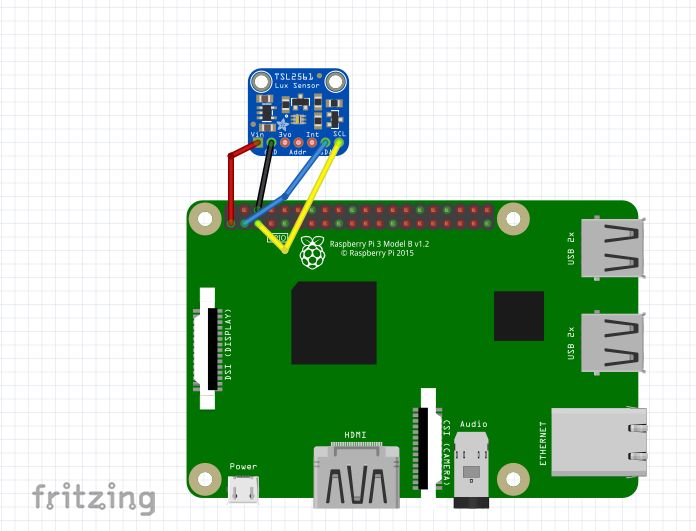
Connect sensor to PI
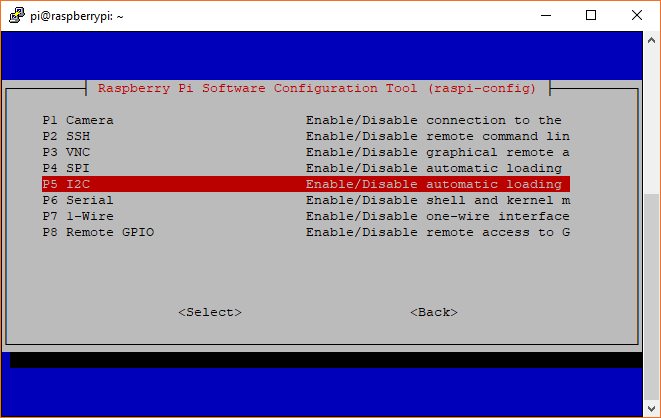
Enable i2c:
Run sudo raspi-config.
Use the down arrow to select 5 Interfacing Options
Arrow down to P5 I2C.
Select yes when it asks you to enable I2C
Also select yes if it asks about automatically loading the kernel module.
Use the right arrow to select the
Select yes when it asks to reboot.
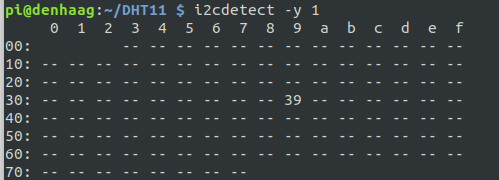
sudo apt-get install -y i2c-tools i2cdetect -y 1 |
should give you:
TSL2561 luxsensor python script
Filename: TSL2561.py
# Distributed with a free-will license. # Use it any way you want, profit or free, provided it fits in the licenses of its associated works. # TSL2561 # This code is designed to work with the TSL2561_I2CS I2C Mini Module available from ControlEverything.com. # https://www.controleverything.com/content/Light?sku=TSL2561_I2CS#tabs-0-product_tabset-2 import smbus import time # Get I2C bus bus = smbus.SMBus(1) # TSL2561 address, 0x39(57) # Select control register, 0x00(00) with command register, 0x80(128) # 0x03(03) Power ON mode bus.write_byte_data(0x39, 0x00 | 0x80, 0x03) # TSL2561 address, 0x39(57) # Select timing register, 0x01(01) with command register, 0x80(128) # 0x02(02) Nominal integration time = 402ms bus.write_byte_data(0x39, 0x01 | 0x80, 0x02) time.sleep(0.5) # Read data back from 0x0C(12) with command register, 0x80(128), 2 bytes # ch0 LSB, ch0 MSB data = bus.read_i2c_block_data(0x39, 0x0C | 0x80, 2) # Read data back from 0x0E(14) with command register, 0x80(128), 2 bytes # ch1 LSB, ch1 MSB data1 = bus.read_i2c_block_data(0x39, 0x0E | 0x80, 2) # Convert the data ch0 = data[1] * 256 + data[0] ch1 = data1[1] * 256 + data1[0] # Output data to screen print "Full Spectrum(IR + Visible) %d lux" %ch0 print "Infrared Value %d lux" %ch1 print "Visible Value %d lux" %(ch0 - ch1) |
Write lux data to csv files
Filename: write_lux_data.bash
#!/bin/bash cd /home/pi/luxsensor python TSL2561.py > values.txt DY=$(date +%Y) DM=$(date +%m) DD=$(date +%d) DH=$(date +%H) DMM=$(date +%M) csvfile1="DATA_"$DY"_"$DM"_combined.csv" csvfile2="DATA_"$DY"_"$DM"_infrared.csv" csvfile3="DATA_"$DY"_"$DM"_visible.csv" # combined V1=`sed -n "1p" values.txt | cut -d " " -f5` echo $DY"-"$DM"-"$DD" "$DH":"$DMM" "$V1 >> $csvfile1 # infrared V2=`sed -n "2p" values.txt | cut -d " " -f3` echo $DY"-"$DM"-"$DD" "$DH":"$DMM" "$V2 >> $csvfile2 # visible V3=`sed -n "3p" values.txt | cut -d " " -f3` echo $DY"-"$DM"-"$DD" "$DH":"$DMM" "$V3 >> $csvfile3 |
For plotting use
Filename: luxsensor.gnuplot.bkp
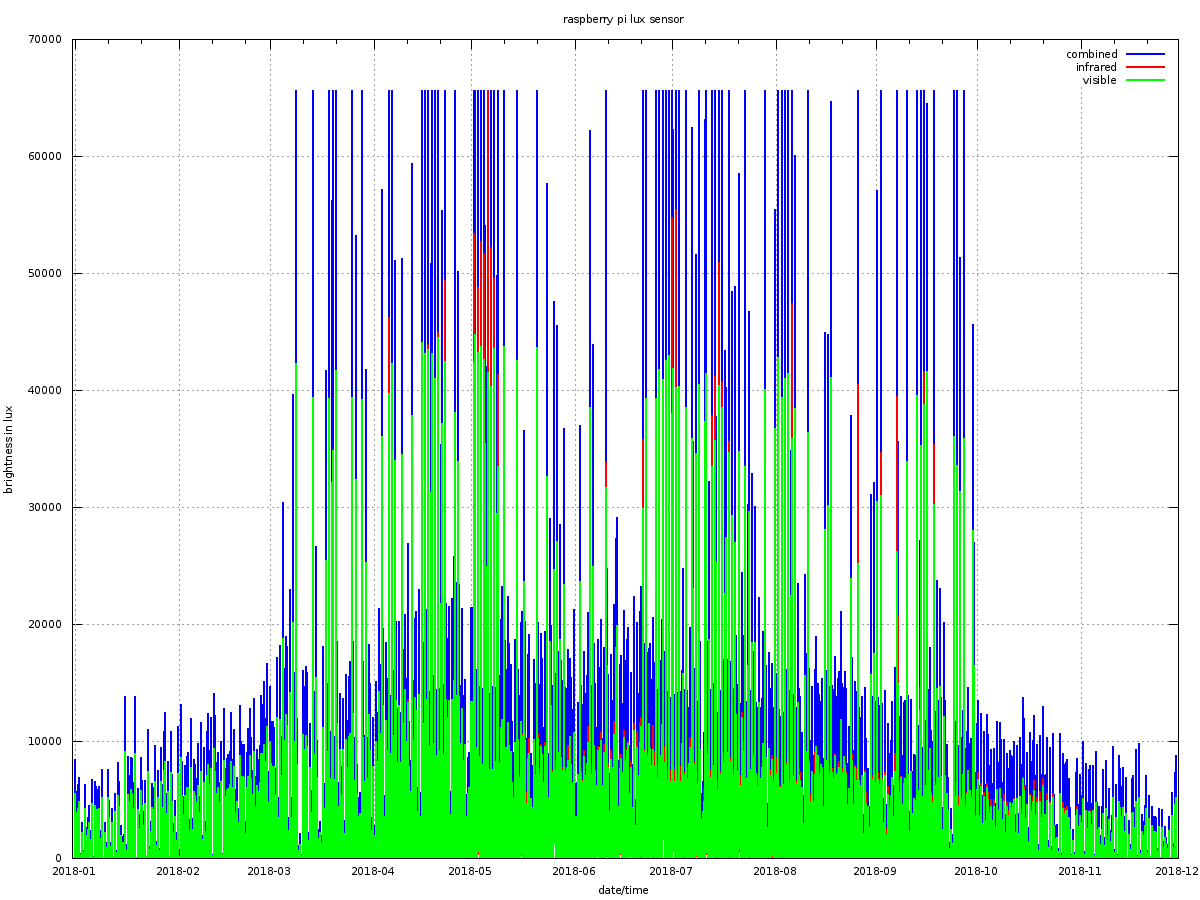
reset set terminal png size 1200,900 enhanced font "/usr/share/fonts/liberation/LiberationSans-Regular.ttf,8" set title "raspberry pi lux sensor" set xlabel "date/time" set ylabel "brightness in lux" set grid set output "lux.png" set xdata time set timefmt "%Y-%m-%d %H:%M" set format x "%d/%H:%M" plot "DATA_REPLACE_combined.csv" u 1:3 with lines lc rgbcolor "blue" lw 2 title "combined", \ "DATA_REPLACE_infrared.csv" u 1:3 with lines lc rgbcolor "red" lw 2 title "infrared", \ "DATA_REPLACE_visible.csv" u 1:3 with lines lc rgbcolor "green" lw 2 title "visible" |
Filename: create_graph_page.bash
#!/bin/bash cd /home/pi/luxsensor DY=$(date +%Y) DM=$(date +%m) cp luxsensor.gnuplot.bkp luxsensor.gnuplot REPLACE=$DY"_"$DM sed -i "s/REPLACE/$REPLACE/g" luxsensor.gnuplot gnuplot < luxsensor.gnuplot DATE=$(date +%d-%b-%Y+%H:%M) cp lux.png /var/www/html/luxsensor cp /var/www/html/luxsensor/luxsensor.html.backup /var/www/html/luxsensor/luxsensor.html sed -i "s/DATE/$DATE/g" /var/www/html/luxsensor/luxsensor.html |
Luxsensor website
Filename: luxsensor.html.backup
<!DOCTYPE html> <HTML> <TITLE></TITLE> <BODY> <H1> Brightness graph of Den Haag at DATE</H1> <img src="lux.png"> <br> <center><a href="history.php"> history </a></center> </BODY> </HTML> |
Filename: history.php
<?php echo "<!doctype html>"; echo "<html lang=\"en\">"; echo "<head>"; echo "<title>history</title>"; echo "</head>"; echo "<body>"; echo "<h1>History light sensor graph Den Haag</h1>"; $arr = array("."); $format = ".png"; sort($arr); for($x=0;$x<count($arr);$x++){ $mm = $arr[$x]; foreach (glob("$mm/*$format") as $filename) { if ( strlen($filename) == 16 ){ $monthNum = substr($filename,6,2); $monthName = date('F', mktime(0, 0, 0, $monthNum, 10)); $year=substr($filename,8,4); $order[$filename] = $year . $monthNum; } if ( strlen($filename) == 14 ){ echo "Jaar overzicht "; $year=substr($filename,6,4); echo "<a href=\" ". $filename ."\">". $year . "</a><br>"; } } } echo "<br>"; asort($order); echo "<BR>"; foreach ($order as $key => $val) { $year= substr($val,0,4); $monthNum = substr($val,4,2); $monthName = date('F', mktime(0, 0, 0, $monthNum, 10)); echo "<a href=\" ". $key ."\">". $monthName . " " . $year . "</a><br>"; } echo "<br>"; echo "<a href=\"luxsensor.html\"> current month </a>"; echo "</body>"; echo "</html>"; ?> |
Year graph
The last day of the month, plot a a year-graph
Filename: backup_lux_pic.bash
#!/bin/bash if [ "$(date --date=tomorrow +\%d)" == "01" ]; then month=$(date +%m) year=$(date +%Y) cp /var/www/html/luxsensor/lux.png /var/www/html/luxsensor/lux_$month$year.png fi |
Filename: create_year_graph.bash
#!/bin/bash if [ "$(date --date=tomorrow +\%d)" == "01" ]; then YEAR=`date +%Y` cd /home/pi/luxsensor rm DATA_$YEAR"_combined_all".csv for f in DATA_$YEAR*"_combined.csv" do echo $f cat $f >> DATA_$YEAR"_combined_all".csv done rm DATA_$YEAR"_visible_all".csv for f in DATA_$YEAR*"_visible.csv" do echo $f cat $f >> DATA_$YEAR"_visible_all".csv done rm DATA_$YEAR"_infrared_all".csv for f in DATA_$YEAR*"_infrared.csv" do echo $f cat $f >> DATA_$YEAR"_infrared_all".csv done cp luxsensor.gnuplot.bkp.year luxsensor.gnuplot.year REPLACE=$YEAR sed -i "s/REPLACE/$REPLACE/g" luxsensor.gnuplot.year gnuplot < luxsensor.gnuplot.year cp lux_$YEAR.png /var/www/html/luxsensor/ else echo " not last day of the month" fi |